
Article
5 min read
Planning Metrics and how to detect cycles
Andreas Thiele
Jul 12, 2021
Chapters
Planning Metrics and how to detect cycles
Welcome to the Planday Tech Blog. It’s a new space on the blog where you can hear directly from the people who help build Planday.
Whether it’s an insight into a brand new feature like Planning Metrics or a deep dive into the features you use every day, the Planday Tech Blog will hear from people across our Product and Engineering team about their passions, their current projects and how they help make your day work.
The first edition is from Senior Software Specialist Andreas Thiele and it’s all about Planning Metrics and how it came to be from the superstars in Planday’s product team.

The motivation behind Planning Metrics
This blog is all about the Planning Metrics feature. I’ll outline the gist of the feature, but if you want more information, you can find it through this link on our Help Centre.
Making software that solves real-life problems for customers often stems from customers having specific needs, and therefore wanting customised features.
In Planday, one of the areas in particular in which people request customisations is in the scheduling system, where customers want specific features and to display customised data. For example, some customers want to see how many shift hours in a day are spent on sickness, training, etc. Another example is simply having the ability to enter a demand for working hours to schedule per day and then subtract the actual scheduled working hours.
As you can see, that quickly becomes a staggering number of new features and metrics to add to solve individual customer needs.
Enter Planday Planning Metrics, which is a feature that allows people to enter numeric data, fetch data from the Planday system and calculate with it. This might seem fluffy and vague, but I hope an example will make it clearer.
Meeting a set demand
Consider the following scenario: A customer wants to enter how many hours are needed for a specific position on a daily basis, then subtract the scheduled hours, and finally show that information for each position in the schedule. This is something that can be done with Planning Metrics, and I will now outline how to do so.
First, I create a new Data Metric for a position. A Data Metric is simply a spreadsheet-like area where you can enter values, in this case per position per day.
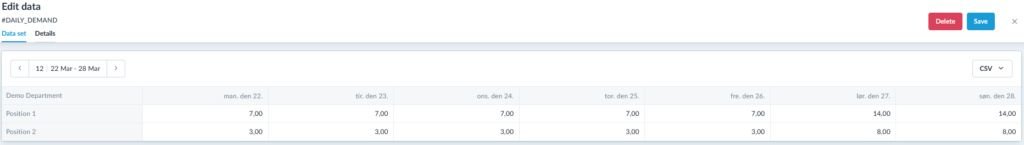
In the above image, I’ve inputted the hours that I need to have scheduled for each position for each day. The metric in the picture has the identifier #DAILY_DEMAND (I’ll soon need this).
The next step is getting schedule data from the system and subtracting the data metric I just added. I do so by creating another metric, this time a Formula Metric, which allows you to enter custom formulas like you would see them in spreadsheet applications. Like:
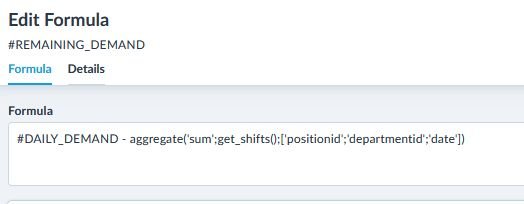
This became convoluted very quickly! But it’s actually not that bad. I’ve highlighted the individual parts of the formula:
#DAILY_DEMAND – aggregate(‘sum’;get_shifts();[‘positionid’;’date’;’departmentid’])
Breaking it down a bit, here is what it does:
- #DAILY_DEMAND:This is a reference to the data metric. If you think spreadsheet-like, this equates to referencing other cells.
- aggregate: This is a function that aggregates data. I need this as multiple shifts can be identical, and I want to subtract the sum of scheduled hours from the demand. So I need these to be unique.
- The function takes three arguments:
- ‘sum’: Dictates how to aggregate identical data. If identical shifts exists, then they will be combined into one data row, which then will have as value the sum of the identical shifts’ values. ‘sum’ is just one of multiple methods, but those options are a talk for another blog post.
- get_shifts(): This is a function that returns a list of shifts for the period I’ll be looking at
- [‘positionid’;’date’;’departmentid’]: This specifies what to group the data by. I want to group the data by positionid and date and department (there’s a good reason for including the department, but please just take my word for it for now). So I use these parameters. If you think SQL like, these equate to the properties of “… GROUP BY a, b, c”
This whole “aggregate” function translates roughly into the following pseudo-SQL:
SELECT SUM(value), positionid, date, departmentid FROM
get_shifts()
GROUP BY positionid, date, departmentid, value
Having created this formula metric, going to the schedule produces the following:
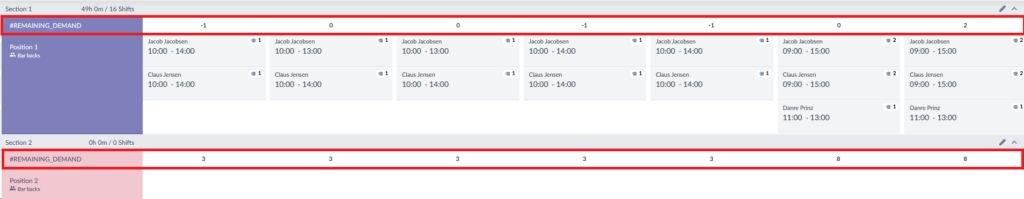
Notice the new areas highlighted with red rectangles. By the simple power of entering, fetching and manipulating data, I have added a custom metric to the schedule.
Planning Metrics also supports employees, sections, and much more. In my opinion, Planning Metrics are an incredibly powerful feature based on very simple concepts.
Some implementation details
As you have probably realised by now, the Planning Metrics project isn’t a common CRUD project and it presents some uncommon challenges. For once, it actually sports a parser and an interpreter, which is very uncommon, for me at least. In fact, there are so many uncommon challenges and decisions that I could probably write dozens of blog entries, but for the rest of this one, I’ll focus on one specific one: Finding references to other metrics (a.k.a. dependencies) and finding cycles in the dependencies.
Building a dependency graph and finding cycles in it
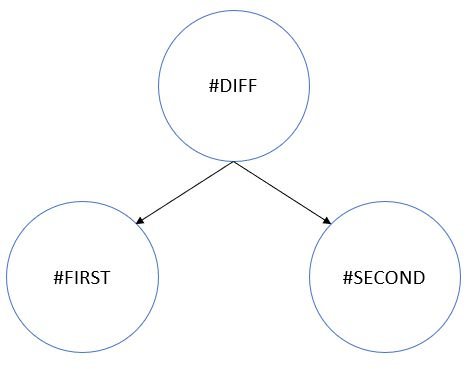
Imagine you have a formula metric you want to evaluate, like: #FIRST – #SECOND. In principle, this is simple, but nothing will stop you from referencing other formulas, which then might reference others and so on. In principle, Planning Metrics support an infinite dependency depth. Such dependencies between metrics can be expressed as an oriented graph, where #DIFF references #FIRST and #SECOND:
One of the only requirements for these formulas is that there must not be an infinite loop like below:
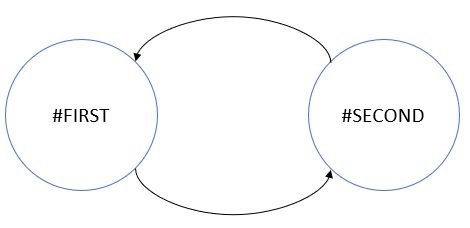
If such an infinite loop exists, the result of the formula can’t be computed. So it is important to be able to identify such loops.
Put differently: Given a graph with dependencies between metrics, how do I check that it does not contain infinite loops? Or stated more formally: How do I check if an oriented graph has cycles?
Having read about this exact problem being used in interview processes at other tech companies, you can imagine my surprise when we actually had to solve it 🙂 I was under the impression that those interview problems were contrived problems that one would never encounter in real life. But apparently, sometimes it happens.
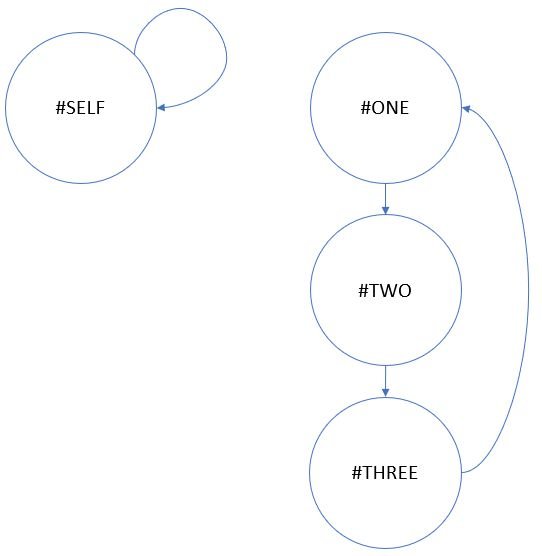
I can map out some simple instances of the problem: Graphs with 1 metric referencing itself, graphs with 2 metrics and an infinite loop, graphs with 3 metrics and infinite loop, and so on. It obviously isn’t scalable to hardcode all checks, but I find visualizing the graphs makes it much easier. Below are some of the simplest cycles.
In practice, it isn’t feasible to load all metrics at once, as it is impossible to tell upfront which are part of the tree of dependencies, so instead, they will have to be loaded when needed. Assuming #DIFF = #FIRST-#SECOND, it can be loaded during two database trips: One for fetching #DIFF, and one for fetching #FIRST and #SECOND. This detail might not seem like much, but it does change our problem in the sense that the full graph isn’t available, to begin with but will instead have to be loaded in batches. The example below illustrates this; #A is the only loaded metric so far, but #B and #C will be loaded through subsequent loads.
A simplifying fact is that all metrics have a string identifier, like #A. This makes recognizing them very easy.
Exploiting the above points, one can now say that: A graph has a cycle if, for any metric in the tree, one of its ancestors has the same identifier. This is true as, for any metric in the graph, there are two scenarios:
- If an ancestor to the current metric has the same identifier, then there exists a way to get to the current metric from itself. Following the path through the tree will mean loading the current metric, again and again, resulting in a cycle.
- No ancestor has the same identifier, therefore a cycle hasn’t been created yet.
The metrics are then loaded as they are identified and the ancestors are checked, and if all the metrics in the graph are loaded without encountering cycles, all is well and the tree is without cycles.
The simple algorithm outlined above has a slight theoretical flaw though. For any metric loaded, the algorithm requires running through all ancestors. In real life, this is probably not a huge deal, as people likely won’t create deeply nested formulas, but, in theory, there’s nothing stopping people from creating a formula that references a formula that references a formula and so on with an arbitrary number of levels.
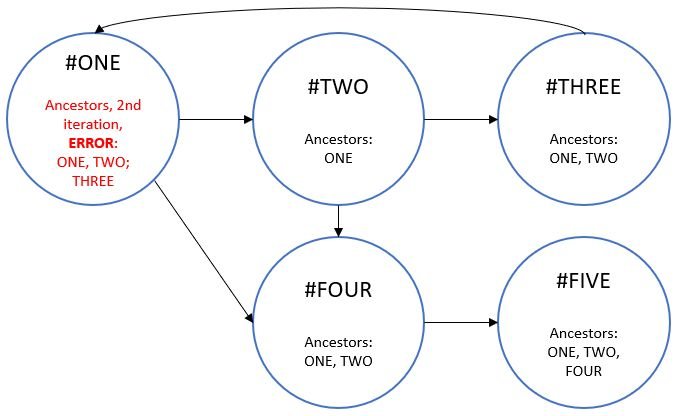
If, for each node in the tree, one had to go all the way up to the root node, that would make this single step an O(n) operation. This is cut down by passing sets of ancestors throughout the graph, as shown in the below example, where when one sees #ONE for the second time, it exists in its own ancestor list and a cycle is then identified.
Exploiting the fact that sets are very good at responding to “Do you know this element?” fast, we can quickly check if the current metric’s identifier exists in the ancestor set. This saves us from traversing all ancestors to make the check and increases the performance of the algorithm greatly by making the step that checks ancestors an O(1) operation instead of O(n).
Wrap up
I hope you enjoyed reading this tech blog as much as I did working on Planning Metrics and writing this blog. As I mentioned earlier, cycle detection is just one problem we had to overcome, and one that I must admit I never thought I’d encounter outside code puzzles or academia. There are so many other surprising problems that we have run into, and we’ll be happy to share our tales from the battles.
Thanks for reading!
Interested in joining Planday’s Product and Engineering team? We are hiring!